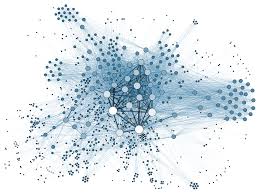
Introduction to the first step in any data project, the data discovery stage.
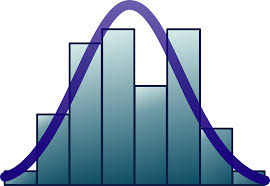
Measures of variability include standard deviation for the sample and for the population. Measures of shape indicate the symmetry of a histogram.
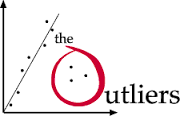
Outliers are an important part of data analytics that must be dealt with.

Data Cleaning

You will conduct statistical analysis on a dataset of Airbnb data and create an appropriate dashboard.
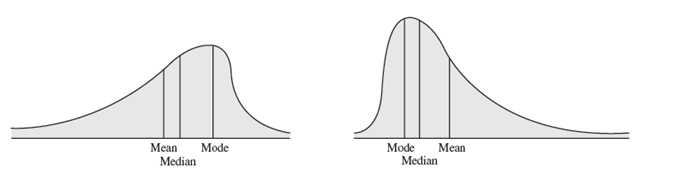
There is a need in data analysis to describe variables using basic statistical tools. Numerical measures of location, dispersion, shape, and association provide more specific quantitative information about data. This lab will introduce you to measure of location such as average, median, and mode. Measures of dispersion which include the range, the variance, and standard deviation. Measures of shape includes coefficient of skewness.

This lab will focus on how to effectively summarise data quantitatively and perform some basic analyses for useful managerial information and insight. You will also cover the use of histograms, box plots and scatter plots.
This lab will focus on how to effectively clean data in excel using the available functions.