In our first set of labs we will be getting familiar with Microsoft Excel, a tool used by many organisations to evaluate daily performance and to make critical strategic and operational decisions.
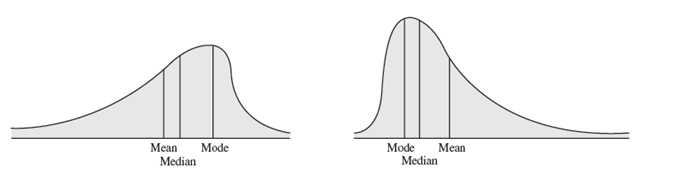
There is a need in data analysis to describe variables using basic statistical tools. Numerical measures of location, dispersion, shape, and association provide more specific quantitative information about data. This lab will introduce you to measure of location such as average, median, and mode. Measures of dispersion which include the range, the variance, and standard deviation. Measures of shape includes coefficient of skewness.

This lab will focus on how to effectively summarise data quantitatively and perform some basic analyses for useful managerial information and insight. You will also cover the use of histograms, box plots and scatter plots.
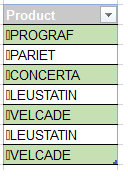
This lab will focus on how to effectively clean data in excel using the available functions.

In this lab you should use the time to work on your continuous assessment.
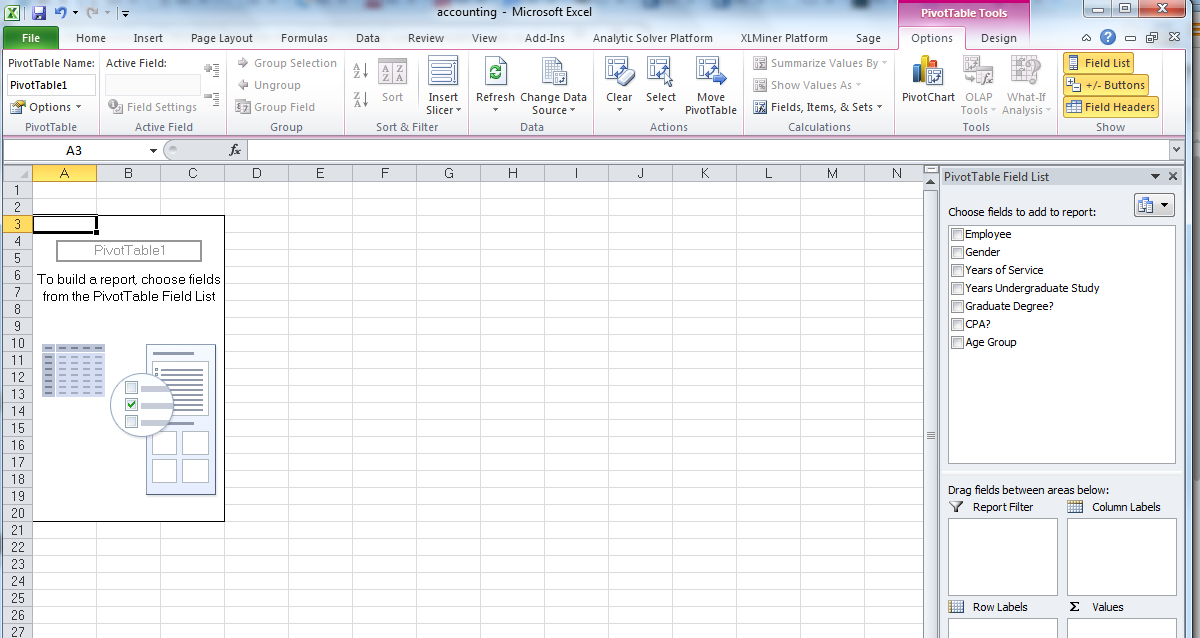
Excel provides powerful tools for distilling a complex data set into meaningful information: Pivot Tables and PowerPivot Tables
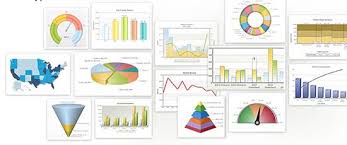
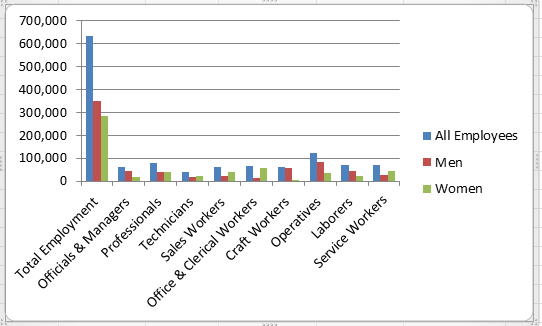
Building effective data visualisation helps an audience anyalse, understand and draw conclusions from summarised data.
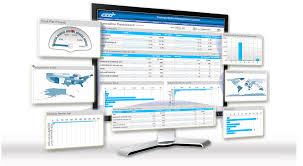
Build a dashboard using interactive options, charts, sliders and conditional formatting

For this lab you can work on completing your continuous assessment.
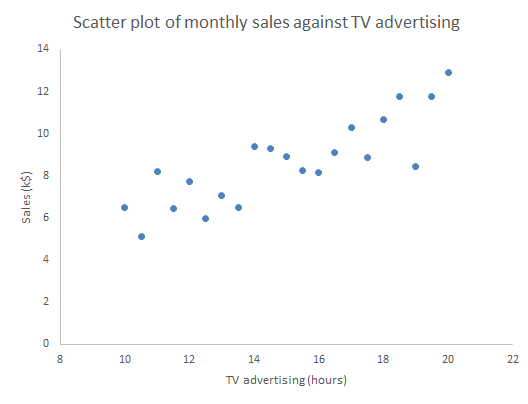
Associations between variables
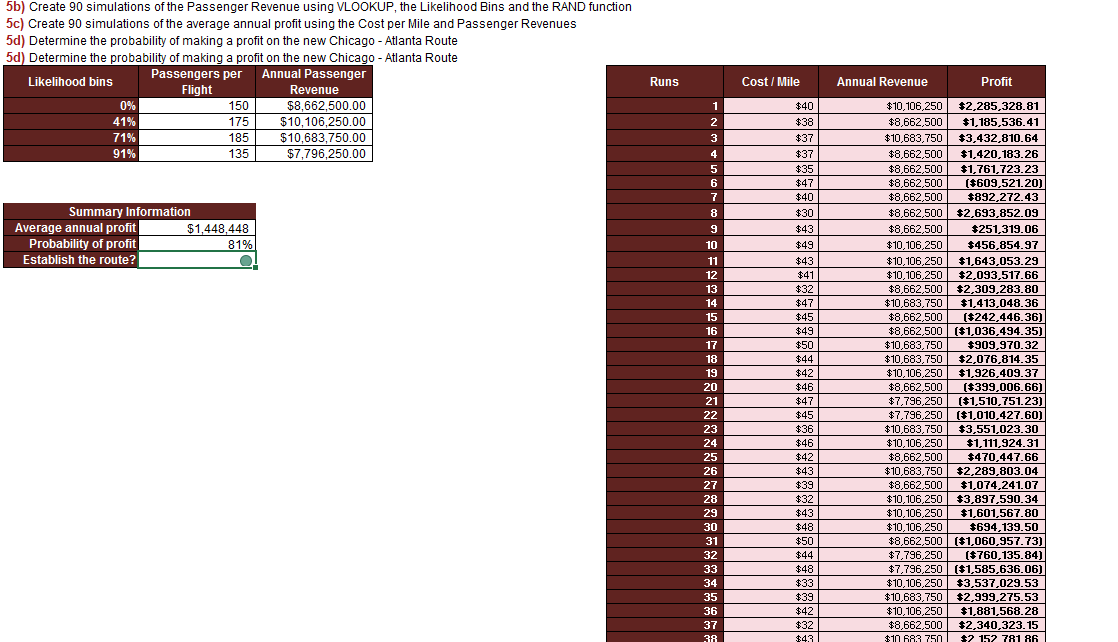
Introduction to Goal Seek, Scenario Manager, Data Tables and Simulation