12 week plan for the module

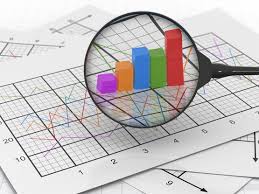
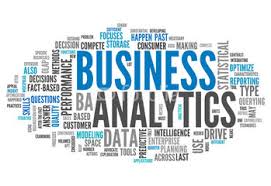
Business Analytics

Top trends in BI according to Tableau, a leader in Business Intelligence software.
Introduction to the first step in any data project, the data discovery stage.
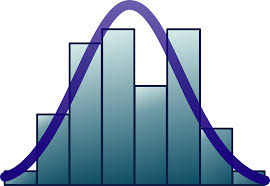
Measures of variability include standard deviation for the sample and for the population. Measures of shape indicate the symmetry of a histogram.
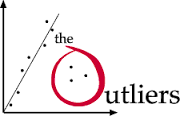
Outliers are an important part of data analytics that must be dealt with.

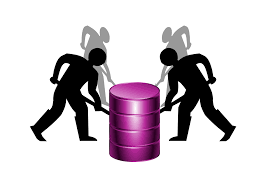
Data Cleaning

You will conduct statistical analysis on a dataset of Airbnb data and create an appropriate dashboard.

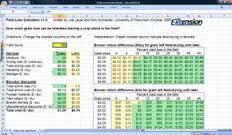
Pivot tables are a very useful tool for the analysis and display of data
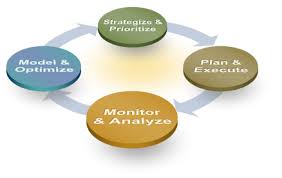
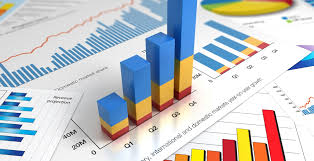
Business Performance Management
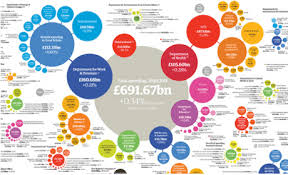
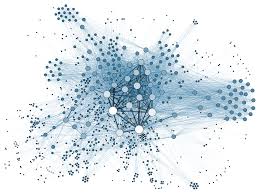
Data Visualisation & Information Visualisation
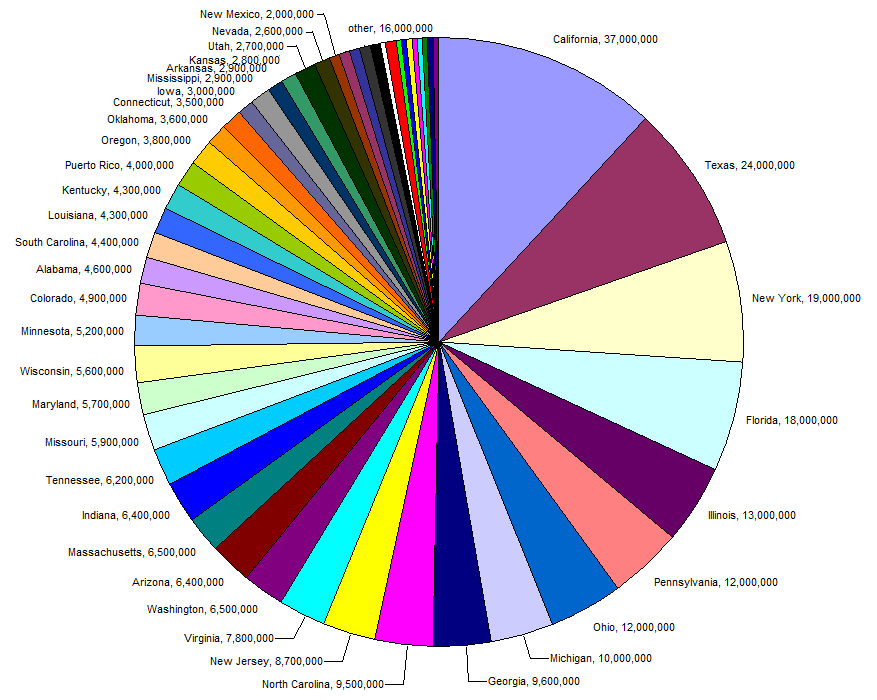
Creating appropriate and effective charts for business analytics is an essential skill
Interactive visual presentation of analysis


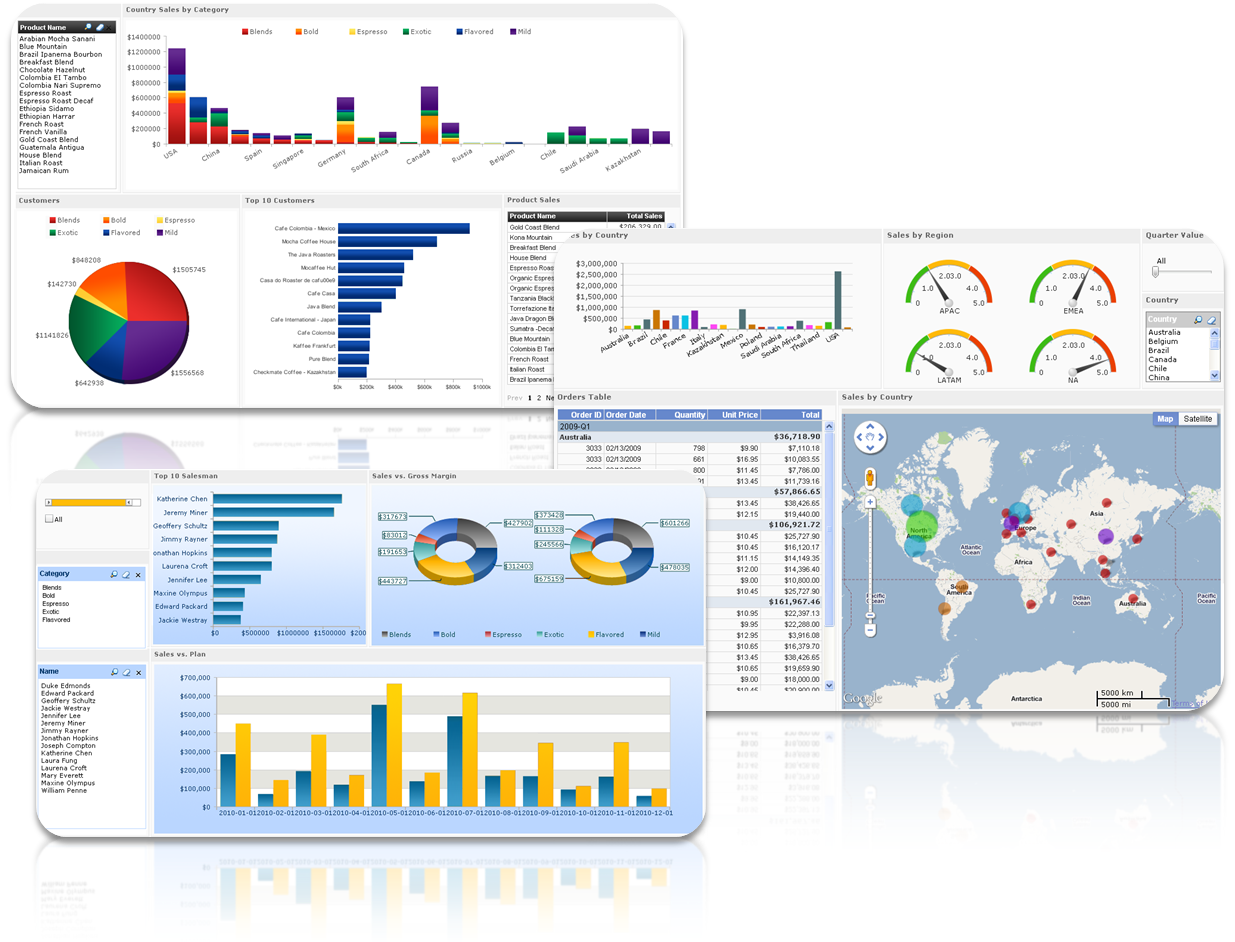
Best Visualisation Examples 2015
Operational Analytics
Business Analytics I
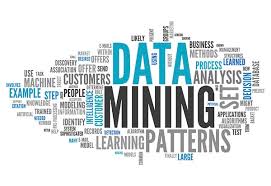
Business application of data mining
Techniques and types of data mining.
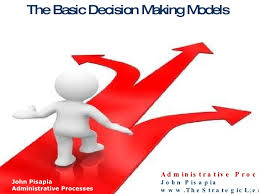
Decision Modelling